
1. บทนำ
ใน Codelab นี้ คุณจะได้เรียนรู้วิธีใช้กราฟ BigQuery เพื่อสร้างมุมมองลูกค้าแบบ 360 องศาและเครื่องมือแนะนำสำหรับ Cymbal Pets ซึ่งเป็นบริษัทค้าปลีกสมมติ คุณจะใช้ประโยชน์จากความสามารถของ SQL เพื่อสร้าง ค้นหา และวิเคราะห์ข้อมูลกราฟภายใน BigQuery โดยตรง รวมถึงรวมเข้ากับการค้นหาเวกเตอร์เพื่อการแนะนำผลิตภัณฑ์ขั้นสูง
BigQuery Graph ช่วยให้คุณสร้างโมเดลความสัมพันธ์ระหว่างเอนทิตีข้อมูล (เช่น ลูกค้า ผลิตภัณฑ์ และคำสั่งซื้อ) เป็นกราฟ ซึ่งจะช่วยให้ตอบคำถามที่ซับซ้อนเกี่ยวกับพฤติกรรมของลูกค้าและความเกี่ยวข้องของผลิตภัณฑ์ได้ง่าย

สิ่งที่คุณต้องดำเนินการ
- สร้างชุดข้อมูลและสคีมา BigQuery สำหรับกราฟสัตว์เลี้ยง Cymbal
- โหลดข้อมูลตัวอย่าง (ลูกค้า ผลิตภัณฑ์ คำสั่งซื้อ ร้านค้า) จาก Cloud Storage
- สร้างกราฟพร็อพเพอร์ตี้ใน BigQuery ที่เชื่อมต่อเอนทิตีเหล่านี้
- แสดงภาพประวัติการซื้อของลูกค้าโดยใช้การค้นหากราฟ
- สร้างระบบแนะนำผลิตภัณฑ์โดยใช้การค้นหาเวกเตอร์
- ปรับปรุงสินค้าแนะนำโดยใช้ความสัมพันธ์ของกราฟ "ซื้อด้วยกัน"
สิ่งที่คุณต้องมี
- เว็บเบราว์เซอร์ เช่น Chrome
- โปรเจ็กต์ Google Cloud ที่เปิดใช้การเรียกเก็บเงิน
Codelab นี้มีไว้สำหรับนักพัฒนาซอฟต์แวร์ทุกระดับ รวมถึงผู้เริ่มต้น
2. ก่อนเริ่มต้น
สร้างโปรเจ็กต์ Google Cloud
- ในคอนโซล Google Cloud ให้เลือกหรือสร้างโปรเจ็กต์ Google Cloud
- ตรวจสอบว่าได้เปิดใช้การเรียกเก็บเงินสำหรับโปรเจ็กต์ที่อยู่ในระบบคลาวด์แล้ว
เริ่มต้น Cloud Shell
- คลิกเปิดใช้งาน Cloud Shell ที่ด้านบนของคอนโซล Google Cloud
- ยืนยันการตรวจสอบสิทธิ์
gcloud auth list
- ยืนยันโปรเจ็กต์
gcloud config get project
- ตั้งค่าหากจำเป็น
export PROJECT_ID=<YOUR_PROJECT_ID>
gcloud config set project $PROJECT_ID
เปิดใช้ API
เรียกใช้คำสั่งนี้เพื่อเปิดใช้ BigQuery API ที่จำเป็น
gcloud services enable bigquery.googleapis.com
3. กำหนดสคีมา
ก่อนอื่น คุณต้องสร้างชุดข้อมูลเพื่อจัดเก็บตารางที่เกี่ยวข้องกับกราฟ และกำหนดสคีมาสำหรับโหนดและขอบ
- สำหรับ Codelab นี้ เราจะเรียกใช้คำสั่ง SQL คุณเรียกใช้คำสั่งเหล่านี้ได้ใน BigQuery Studio > SQL Editor หรือใช้คำสั่ง
bq queryใน Cloud Shell เราจะถือว่าคุณใช้โปรแกรมแก้ไข SQL ของ BigQuery เพื่อให้ได้รับประสบการณ์การใช้งานที่ดียิ่งขึ้นกับคำสั่งสร้างแบบหลายบรรทัด
 - สร้าง
cymbal_pets_demoชุดข้อมูล
CREATE SCHEMA IF NOT EXISTS cymbal_pets_demo;
- สร้างตารางสำหรับ
order_items,products,orders,stores,customersและco_related_products_for_angelicaตารางเหล่านี้จะทำหน้าที่เป็นข้อมูลต้นทางสำหรับกราฟของเรา
CREATE TABLE IF NOT EXISTS cymbal_pets_demo.order_items
(
  order_id INT64,
  product_id INT64,
  order_item_id INT64,
  quantity INT64,
  price FLOAT64,
  PRIMARY KEY (order_id, product_id, order_item_id) NOT ENFORCED
)
CLUSTER BY order_item_id;

CREATE TABLE IF NOT EXISTS cymbal_pets_demo.products
(
  product_id INT64,
  product_name STRING,
  brand STRING,
  category STRING,
  subcategory INT64,
  animal_type INT64,
  search_keywords INT64,
  price FLOAT64,
  description STRING,
  inventory_level INT64,
  supplier_id INT64,
  average_rating FLOAT64,
  uri STRING,
  embedding ARRAY<FLOAT64>,
  PRIMARY KEY (product_id) NOT ENFORCED
)
CLUSTER BY product_id;

CREATE TABLE IF NOT EXISTS cymbal_pets_demo.orders
(
  customer_id INT64,
  order_id INT64,
  shipping_address_city STRING,
  store_id INT64,
  order_date DATE,
  order_type STRING,
  payment_method STRING,
  PRIMARY KEY (order_id) NOT ENFORCED
)
PARTITION BY order_date
CLUSTER BY order_id;

CREATE TABLE IF NOT EXISTS cymbal_pets_demo.stores
(
  store_id INT64,
  store_name STRING,
  address_state STRING,
  address_city STRING,
  latitude FLOAT64,
  longitude FLOAT64,
  opening_hours STRUCT<Monday STRING, Tuesday STRING, Wednesday STRING, Thursday STRING, Friday STRING, Saturday STRING, Sunday STRING>,
  manager_id INT64,
  PRIMARY KEY (store_id) NOT ENFORCED
)
CLUSTER BY store_id;

CREATE TABLE IF NOT EXISTS cymbal_pets_demo.customers
(
  customer_id INT64,
  first_name STRING,
  last_name STRING,
  email STRING,
  gender STRING,
  address_city STRING,
  address_state STRING,
  loyalty_member BOOL,
  PRIMARY KEY (customer_id) NOT ENFORCED
)
CLUSTER BY customer_id;

CREATE TABLE IF NOT EXISTS cymbal_pets_demo.co_related_products_for_angelica
(
  angelica_product_id INT64,
  other_product_id INT64,
  co_purchase_count INT64
);
ตอนนี้คุณได้กำหนดโครงสร้างสำหรับข้อมูลกราฟแล้ว
4. โหลดข้อมูล
ตอนนี้ ให้ป้อนข้อมูลตัวอย่างจาก Cloud Storage ลงในตาราง
เรียกใช้LOAD DATAคำสั่งต่อไปนี้ในโปรแกรมแก้ไข SQL ของ BigQuery
LOAD DATA INTO `cymbal_pets_demo.customers`
FROM FILES (
    format = 'AVRO',
    uris = ['gs://sample-data-and-media/cymbal-pets/tables/customers/*.avro']
);

LOAD DATA INTO `cymbal_pets_demo.order_items`
FROM FILES (
    format = 'AVRO',
    uris = ['gs://sample-data-and-media/cymbal-pets/tables/order_items/*.avro']
);

LOAD DATA INTO `cymbal_pets_demo.orders`
FROM FILES (
    format = 'AVRO',
    uris = ['gs://sample-data-and-media/cymbal-pets/tables/orders/*.avro']
);

LOAD DATA INTO `cymbal_pets_demo.products`
FROM FILES (
    format = 'AVRO',
    uris = ['gs://sample-data-and-media/cymbal-pets/tables/products/*.avro']
);

LOAD DATA INTO `cymbal_pets_demo.stores`
FROM FILES (
    format = 'AVRO',
    uris = ['gs://sample-data-and-media/cymbal-pets/tables/stores/*.avro']
);
คุณจะเห็นข้อความยืนยันว่าระบบได้โหลดแถวลงในแต่ละตารางแล้ว
5. สร้างกราฟพร็อพเพอร์ตี้
เมื่อโหลดข้อมูลแล้ว คุณจะกำหนดกราฟพร็อพเพอร์ตี้ได้ ซึ่งจะบอก BigQuery ว่าตารางใดแสดงโหนด (เอนทิตี เช่น ลูกค้า ผลิตภัณฑ์) และตารางใดแสดงขอบ (ความสัมพันธ์ เช่น "เข้าชม" "สั่งซื้อ" "มี")

เรียกใช้คำสั่ง DDL ต่อไปนี้
CREATE OR REPLACE PROPERTY GRAPH cymbal_pets_demo.PetsOrderGraph
NODE TABLES (
  cymbal_pets_demo.customers KEY(customer_id) LABEL Customer,
  cymbal_pets_demo.products KEY(product_id) LABEL Products,
  cymbal_pets_demo.stores KEY(store_id) LABEL Stores,
  cymbal_pets_demo.orders KEY(order_id) LABEL Orders
)
EDGE TABLES (
  cymbal_pets_demo.orders as customer_to_store_edge
    KEY (order_id)
    SOURCE KEY (customer_id) references customers(customer_id)
    DESTINATION KEY (store_id) references stores(store_id)
    LABEL Visited
    PROPERTIES ALL COLUMNS,

  cymbal_pets_demo.order_items
    KEY (order_item_id)
    SOURCE KEY (order_id) references orders(order_id)
    DESTINATION KEY (product_id) references products(product_id)
    LABEL Has
    PROPERTIES ALL COLUMNS,

  cymbal_pets_demo.orders as customer_to_orders_edge
    KEY (order_id)
    SOURCE KEY (customer_id) references customers(customer_id)
    DESTINATION KEY (order_id) references orders(order_id)
    LABEL Placed
    PROPERTIES ALL COLUMNS,

  cymbal_pets_demo.co_related_products_for_angelica
    KEY (angelica_product_id)
    SOURCE KEY (angelica_product_id) references products(product_id)
    DESTINATION KEY (other_product_id) references products(product_id)
    LABEL BoughtTogether
    PROPERTIES ALL COLUMNS
);
ซึ่งจะสร้างกราฟ PetsOrderGraph ที่ช่วยให้เราสามารถดำเนินการกราฟทราเวอร์ซโดยใช้ตัวดำเนินการ GRAPH_TABLE
6. แสดงภาพประวัติการซื้อของลูกค้าทั้งหมด
เปิด Notebook ใหม่ใน BigQuery Studio

สำหรับส่วนการแสดงภาพและคำแนะนำของ Codelab นี้ เราจะใช้สมุดบันทึก Google Colab ใน BigQuery Studio ซึ่งช่วยให้เราเห็นภาพผลลัพธ์ของกราฟได้อย่างง่ายดาย
BigQuery Graph Notebook ได้รับการติดตั้งใช้งานเป็น IPython Magics การเพิ่มคำสั่งวิเศษ %%bigquery ด้วยฟังก์ชัน TO_JSON จะช่วยให้คุณเห็นภาพผลลัพธ์ได้ตามที่แสดงในส่วนต่อไปนี้
สมมติว่า Cymbal Pets ต้องการภาพข้อมูล 360 องศาของลูกค้าทั้งหมดและการซื้อที่ลูกค้าทำในช่วงเวลาที่เฉพาะเจาะจง
เรียกใช้โค้ดต่อไปนี้ในเซลล์ใหม่
%%bigquery --graph

GRAPH cymbal_pets_demo.PetsOrderGraph
  # finds the customer node and then finds all
  # the Orders nodes that are connected to that customer through the
  # Placed relationship
  MATCH (customer:Customer)-[placed:Placed]->(ordr:Orders)-[has:Has]->(product:Products)
  # filters the Orders nodes to only include those where the
  # order_date is within the last 3 months.
  WHERE ordr.order_date >= date('2024-11-27')
  # # This line finds all the Products nodes that are connected to the
  # # filtered Orders nodes through the Has relationship.
  MATCH p=(customer:Customer)-[placed:Placed]->(ordr:Orders)-[has:Has]->(product:Products)
  LIMIT 40
  RETURN
    TO_JSON(p) as paths
คุณควรเห็นภาพที่แสดงผลลัพธ์ของกราฟ

7. แสดงภาพประวัติการซื้อของ Angelica
สมมติว่า Cymbal Pets ต้องการเจาะลึกข้อมูลลูกค้าชื่อ Angelica Russell โดยต้องการวิเคราะห์ผลิตภัณฑ์ที่ Angelica ซื้อในช่วง 3 เดือนที่ผ่านมา และร้านค้าที่ลูกค้าเข้าชม
%%bigquery --graph

GRAPH cymbal_pets_demo.PetsOrderGraph
  # finds the customer node with the name "Angelica Russell" and then finds all
  # the Orders nodes that are connected to that customer through the
  # Placed relationship and all the Products nodes that are connected to the
  # filtered Orders nodes through the Has relationship.
   MATCH p=(customer:Customer {first_name: 'Angelica', last_name: 'Russell'})-[placed:Placed]->(ordr:Orders)-[has:Has]->(product:Products)
  # filters the Orders nodes to only include those where the
  # order_date is within the last 3 months.
  WHERE ordr.order_date >= date('2024-11-27')
  # finds the Stores nodes where Angelica placed order from
  MATCH p2=(customer)-[visited:Visited]->(store:Stores)
  RETURN
    TO_JSON(p) as path, TO_JSON(p2) as path2

8. การแนะนำผลิตภัณฑ์โดยใช้การค้นหาเวกเตอร์
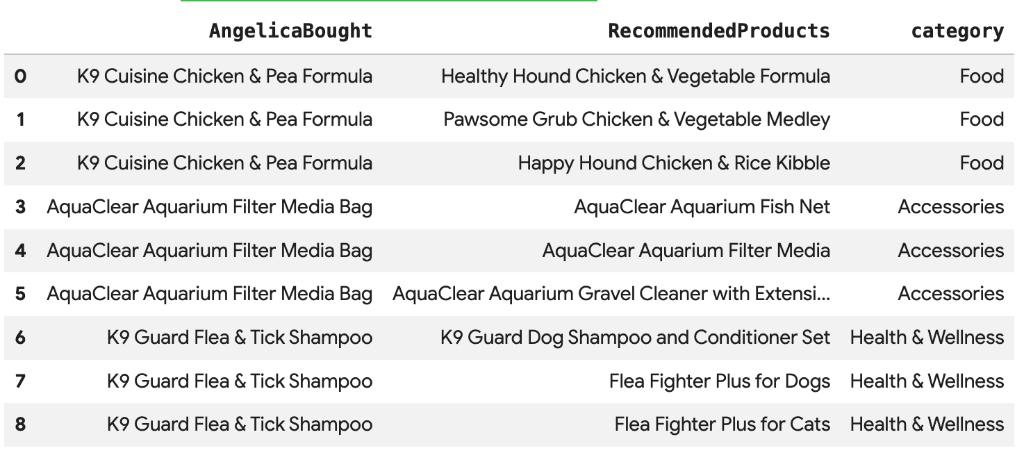
Cymbal Pets ต้องการแนะนำผลิตภัณฑ์ให้ Angelica ตามสิ่งที่เธอซื้อไปเมื่อเร็วๆ นี้ เราสามารถใช้การค้นหาเวกเตอร์เพื่อค้นหาผลิตภัณฑ์ที่มีการฝังที่คล้ายกับการซื้อที่ผ่านมาของเธอ
เรียกใช้สคริปต์ SQL ต่อไปนี้ในเซลล์ Colab ใหม่ สคริปต์นี้จะทำสิ่งต่อไปนี้
- ระบุผลิตภัณฑ์ที่แอนเจลิกาซื้อเมื่อเร็วๆ นี้
- ใช้
VECTOR_SEARCHเพื่อค้นหาผลิตภัณฑ์ที่คล้ายกัน 4 รายการแรกจากตารางproducts
หมายเหตุ: ขั้นตอนนี้ถือว่าคุณได้เรียกใช้ AI.GENERATE_EMBEDDINGS เพื่อสร้างคอลัมน์การฝังในตารางผลิตภัณฑ์แล้ว
%%bigquery
DECLARE products_bought_by_angelica ARRAY<INT64>;

-- 1. Get IDs of products bought by Angelica
SET products_bought_by_angelica = (
  SELECT ARRAY_AGG(product_id) FROM
   GRAPH_TABLE(
    cymbal_pets_demo.PetsOrderGraph
      MATCH (c:Customer {first_name: 'Angelica', last_name: 'Russell'})-[placed:Placed]->(o:Orders)
      WHERE o.order_date >= date('2024-11-27')
      MATCH (o)-[has_edge:Has]->(p:Products)
      RETURN DISTINCT p.product_id as product_id
  ));

-- 2. Find similar products using vector search
SELECT
  query.product_name as AngelicaBought,
  base.product_name as RecommendedProducts,
  base.category
FROM
  VECTOR_SEARCH(
    TABLE cymbal_pets_demo.products,
    'embedding',
    (SELECT * FROM cymbal_pets_demo.products
     WHERE product_id IN UNNEST(products_bought_by_angelica)),
    'embedding',
    top_k => 4)
WHERE query.product_name <> base.product_name;
คุณควรเห็นรายการผลิตภัณฑ์แนะนำที่มีความหมายคล้ายกับสิ่งที่ Angelica ซื้อ
9. สินค้าแนะนำโดยใช้ความสัมพันธ์ "ซื้อร่วมกัน"
เทคนิคการแนะนำที่มีประสิทธิภาพอีกอย่างคือ "การกรองร่วม" ซึ่งเป็นการแนะนำผลิตภัณฑ์ที่ผู้ใช้รายอื่นมักซื้อพร้อมกัน เราได้สร้างโมเดลนี้เป็นBoughtTogetherขอบในกราฟ
สำหรับการแนะนำผลิตภัณฑ์ที่ซื้อร่วมกัน Cymbal Pets ได้ดำเนินการค้นหากราฟแบบออฟไลน์เชิงวิเคราะห์เพื่อค้นหาผลิตภัณฑ์ยอดนิยมที่จะแนะนำสำหรับผลิตภัณฑ์แต่ละรายการที่ Angelica ซื้อ
%%bigquery
CREATE OR REPLACE TABLE cymbal_pets_demo.co_related_products_for_angelica AS
SELECT
    angelica_product_id,
    other_product_id,
    co_purchase_count
FROM (
    SELECT
        angelicaProduct.product_id AS angelica_product_id,
        otherProduct.product_id AS other_product_id,
        count(otherProduct) AS co_purchase_count,
        # ensures that the row numbering is done separately for each angelica_product_id
        ROW_NUMBER() OVER (PARTITION BY angelicaProduct.product_id ORDER BY count(otherProduct) DESC) AS rn
    FROM
        GRAPH_TABLE (cymbal_pets_demo.PetsOrderGraph
          MATCH (angelica:Customer {first_name: 'Angelica', last_name: 'Russell'})-[:Placed]->(o:Orders)-[:Has]->(angelicaProduct:Products)
          WHERE o.order_date >= date('2024-11-27')
          WITH angelica, angelicaProduct
          MATCH (otherCustomer:Customer)-[:Placed]->(otherOrder:Orders)-[:Has]->(angelicaProduct) # Find orders where Angelica's products were bought
          WHERE otherCustomer <> angelica # Exclude Angelica's own orders
          WITH angelicaProduct, otherOrder
          MATCH (otherOrder)-[:HAS]->(otherProduct:Products) # Find other products in those orders
          WHERE angelicaProduct <> otherProduct # Exclude the original product.
          RETURN angelicaProduct, otherProduct, otherOrder
        )
    GROUP BY
        angelicaProduct.product_id, otherProduct.product_id
)
WHERE rn <= 3; # only keep top 3 co-related products

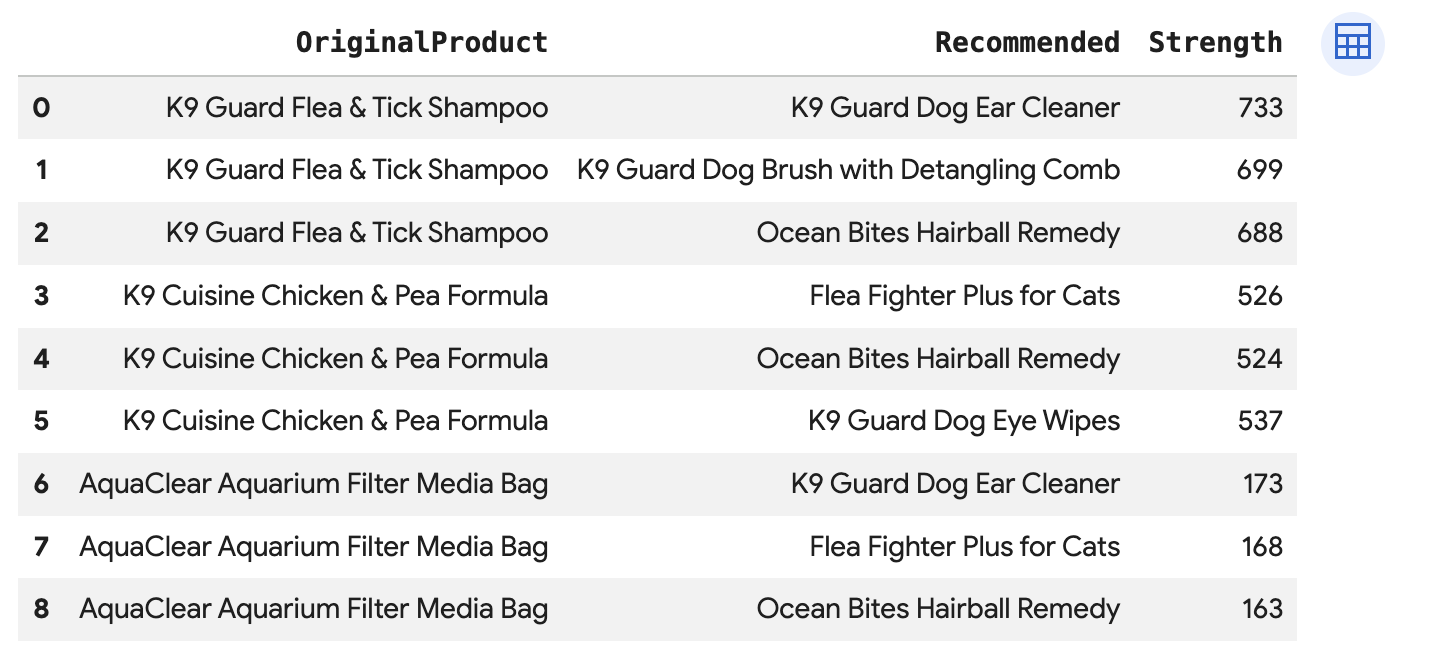
เรียกใช้การค้นหานี้เพื่อแนะนำผลิตภัณฑ์ที่เชื่อมต่อกับการซื้อของ Angelica โดยตรงผ่านBoughtTogether Edge
%%bigquery
SELECT * FROM GRAPH_TABLE(
  cymbal_pets_demo.PetsOrderGraph
  MATCH (customer:Customer {first_name: 'Angelica', last_name: 'Russell'})-[placed:Placed]->(ordr:Orders)
  WHERE ordr.order_date >= date('2024-11-27')
  MATCH (ordr)-[has:Has]->(product:Products)
  MATCH (product)-[bought_together:BoughtTogether]->(recommended_product:Products)
  RETURN
    product.product_name AS OriginalProduct,
    recommended_product.product_name AS Recommended,
    bought_together.co_purchase_count AS Strength
);
คำค้นหานี้จะย้อนกลับจากลูกค้า -> คำสั่งซื้อ -> ผลิตภัณฑ์ -> (ซื้อร่วมกัน) -> ผลิตภัณฑ์ที่แนะนำ ซึ่งจะแสดงคำแนะนำตามพฤติกรรมการซื้อโดยรวม
10. ล้างข้อมูล
โปรดลบทรัพยากรที่สร้างขึ้นระหว่างการทำ Codelab นี้เพื่อหลีกเลี่ยงการเรียกเก็บเงินอย่างต่อเนื่องในบัญชี Google Cloud
ลบชุดข้อมูลและตารางทั้งหมด
DROP SCHEMA IF EXISTS cymbal_pets_demo CASCADE;
หากสร้างโปรเจ็กต์ใหม่สำหรับ Codelab นี้ คุณก็ลบโปรเจ็กต์ได้ด้วย โดยทำดังนี้
gcloud projects delete $PROJECT_ID
11. ขอแสดงความยินดี
ยินดีด้วย คุณสร้างมุมมองลูกค้า 360 และเครื่องมือแนะนำโดยใช้กราฟ BigQuery ได้สำเร็จแล้ว
สิ่งที่คุณได้เรียนรู้
- วิธีสร้างกราฟพร็อพเพอร์ตี้ใน BigQuery
- วิธีโหลดข้อมูลลงในโหนดและขอบของกราฟ
- วิธีค้นหารูปแบบกราฟโดยใช้
GRAPH_TABLEและMATCH - วิธีรวมการค้นหากราฟกับการค้นหาเวกเตอร์เพื่อรับคำแนะนำแบบไฮบริด
ขั้นตอนถัดไป
- ดูเอกสารประกอบของ BigQuery Graph
- ดูข้อมูลเพิ่มเติมเกี่ยวกับการค้นหาเวกเตอร์ใน BigQuery